07-25-2026


|
Getting your Trinity Audio player ready...
|
This post originally appeared on the Unbounded Capital website, and we republished with permission from Sina Nazari & Zach Resnick.
Introduction
At Unbounded Capital, we are convinced that the future of blockchain largely belongs to a highly scalable blockchain. After years of research and major pivots in our investment focus, the only blockchain we think that has a chance of scaling to meet global demand is Bitcoin SV. We are constantly looking to see if there are other emerging scalable blockchains that could match or surpass all that Bitcoin SV has accomplished to date, and we are excited to finally be making much of our internal research available to the public.
In determining which blockchains are scalable—i.e., can process high transaction volumes at low costs—we (1) compare the transaction counts of various blockchains over time. Further, (2) we compare their transaction fees as a function of their transaction volume as an indication of the network’s congestion (because higher transaction fees are both costly, and are an indicator that the network is congested and there is competition for passing a transaction over the network). Finally, because we have noticed a unique property of the BSV network where BSV transactions get cheaper with higher transaction volumes, (3) we tested the relationship between transaction volumes and transaction fees to see whether the relationship is strong or weak, and positive or negative.
We collected raw transaction volumes and transaction fee data from reliable sources which run their own blockchain nodes. Data for ‘Bitcoin’ Core (BTC), ‘Bitcoin’ Cash (BCH), Bitcoin SV (BSV), Ethereum (ETH), Cardano (ADA), Polkadot (DOT), EOS (EOS), Basic Attention Token (BAT), Digibyte (DGB), Chainlink (LINK), and Quant Network (QNT) were acquired from CoinMetrics. Data for Polygon (MATIC) were acquired from Polygon’s official explorer. Data for Algorand (ALGO), Binance Smart Chain (BNB), Cosmos (ATOM), and Stellar (XLM) were acquired from Bitquery. Data for Solana (SOL) were acquired from Dune. For additional blockchains that were important but for which raw data was not available, the graphs of their transaction volumes and transaction fees over time were acquired from Nansen, but these data were not raw and could not be further analyzed.
We went to great lengths to acquire the data we have, not just scouring every possible price of public and paid potential data source. For example, to acquire Solana’s data, we reached out to the Solana Foundation, Solana’s co-founders, and leading investors in Solana’s blockchain, but there were either crickets or responses that indicated this data doesn’t exist.
We would appreciate it if you, as a reader, could help us find a source of raw data for Solana, Avalanche, and other blockchain networks processing many transactions that we could leverage for this analysis. Any support or feedback on this research would be greatly appreciated: [email protected]
We will add the data for more blockchains as the data becomes available. In the coming months, we will further expand this research so anyone can compare the transaction volumes and transaction fees of various blockchains on-demand and build customized graphs.
Part 1: Transaction counts
Figure 1: Transaction count over time for various blockchains
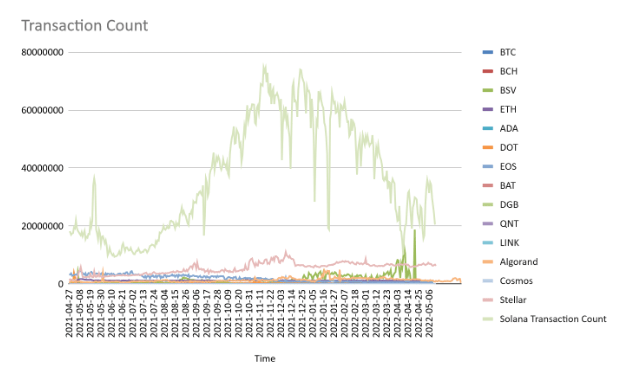
This graph demonstrates that the transaction count of SOL is significantly higher than other blockchains, and it is followed by BSV. Whereas most of the blockchains are transacting at their cap (indicated by a horizontal line exemplified by ETH’s graph), the BSV blockchain is not operating at capacity (indicated by peaks that rise and fall). Chainlink (LINK), EOS, Solana (SOL), and Bitcoin SV (BSV) are the only blockchains that have exceeded 5M transactions per day on one or more occasions.
The vast majority of Solana transactions however are what they call vote transactions, which are not initiated by users for anything of value to them but are key to keeping the network secure. With this in mind, while Solana generally has the highest transaction count of any blockchain, it’s somewhat comparable with BSV when removing voting transactions. We dive into this voting transaction phenomenon further in the section on Solana near the end of the research.
Part 2: Transaction fees
Figure 2: Transaction fees per USD for various blockchains
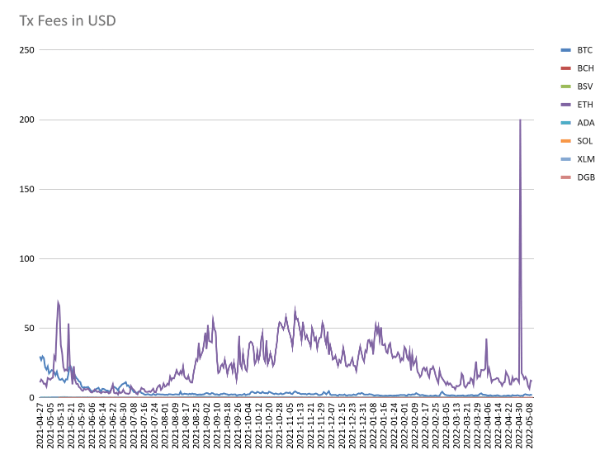
As you can see, the transaction fees for scalable blockchains are a fraction of fees for other blockchains. These blockchains allow for sending transactions at fees below a cent, whereas the less scalable blockchains (e.g. ETH, BTC) require much higher fees. For example, ETH transactions frequently require $25-50 per transaction.
Figure 3: Transaction fees per USD for various scalable blockchains
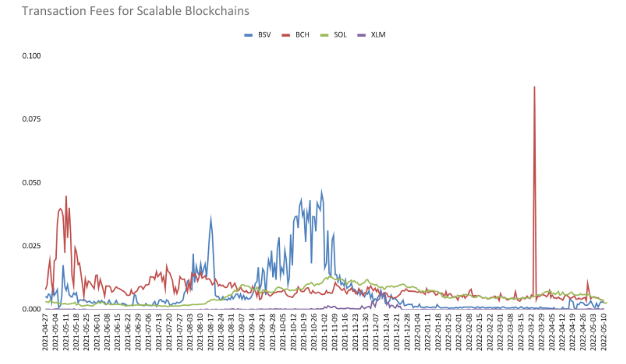
This graph demonstrates transaction costs over the past year for various scalable blockchains. As you can see, despite some spikes in all networks, the transaction fees are very insignificant. As you can see, currently, the fees for Stellar (XLM) are the lowest, followed by Bitcoin SV (BSV).
Part 3: Relationship between transaction fees and transaction volumes
In this part, we analyze whether the increased transactions of different networks result in congestion (i.e. transaction prices go up along with higher transaction count) or result in economies of scale (i.e. transaction prices go down along with higher transaction counts).
Figure 3 demonstrates that for BSV, there is an inverse relationship between transaction volumes and transaction fees. In other words, the more transactions that take place, the lower the cost of the transaction. It is also notable that the maximum transaction fee peaks out below 5 cents—and this is the second-lowest value among the blockchains for which there is public data we have analyzed. BSV’s transaction fees were only second to Stellar (XLM) which might not qualify as a blockchain by certain measures. We will discuss the “blockchain-ness” of Stellar later in Part 3 of the research paper.
In BSV, transaction fees increase, not by increasing transaction volume, but by additional bytes of data being added to the transaction. Hence, more data-intensive transactions require higher transaction fees.
Figure 4
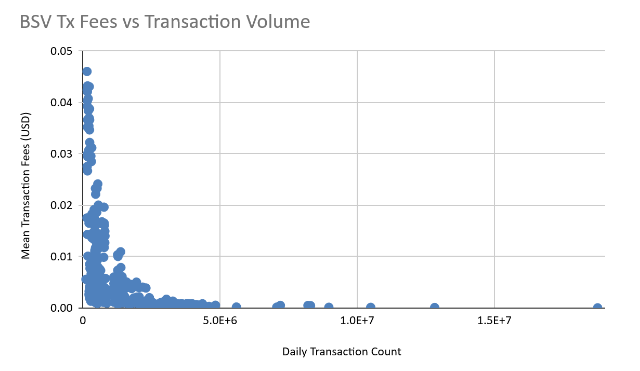
Figure 5
Scatterplot for BTC demonstrates that as transaction volume increases, the transaction fees increase as well. This is a strong correlation effect.
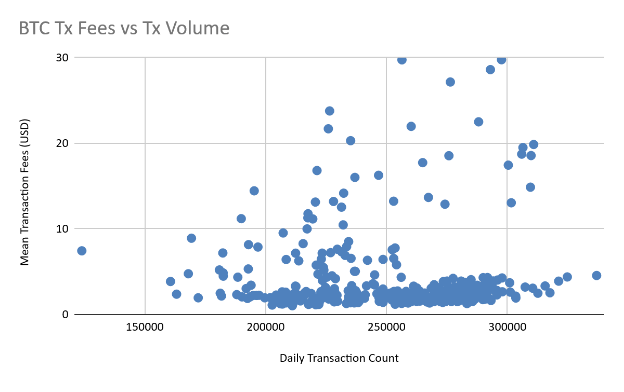
Figure 6
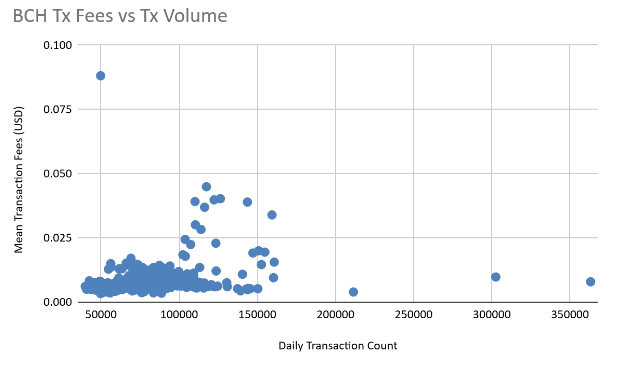
Scatterplot for BCH demonstrates that for lower transaction volumes (<100,000), transaction fees are pretty stable and constant, but for higher transaction volumes (>100,000) transaction fees rise quickly.
Figures 7 and 8 refer to Ethereum
Figure 7
Transaction Volume and Transaction Fees for
Ethereum Plotted over time
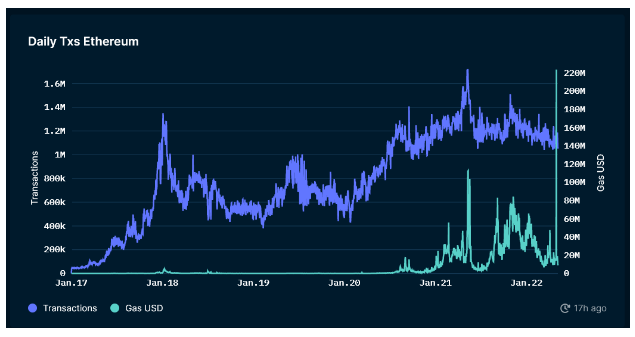
Figure 8
Ethereum’s Transaction Fees Compared to its
Transaction Counts
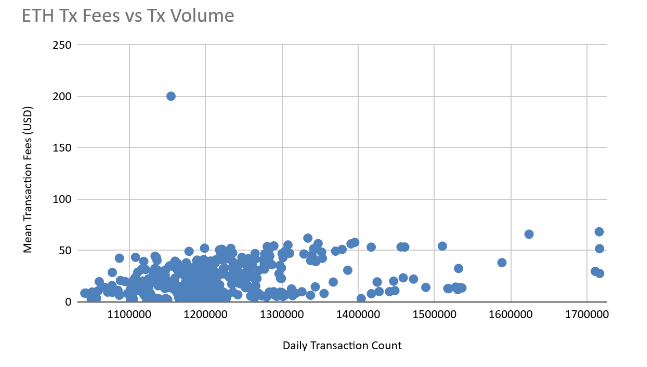
Figure 7 demonstrates that the Ethereum network has achieved close to 1.7m transactions per day, with fees rising to 220m on the highest occasion (and typical fees include 50-100m). The typical fees per transaction can rise to about $50.
Figure 8 shows that Ethereum transaction volumes are pretty consistent as the network is occupied with the current volume of transactions. However, we can see that there is a slight positive correlation between transaction count and transaction fees. The small correlation is understood in the context that for a constantly jammed network, the prices for fees are calculated by taking into account the scope of the timeframe in which the transaction might take place—which might span longer than a day. In other words, there is an expectation buffer for transaction fees over time.
Figure 9
This figure demonstrates that there is a strong positive correlation between transaction volume and transaction fees for the Cardano (ADA) network.
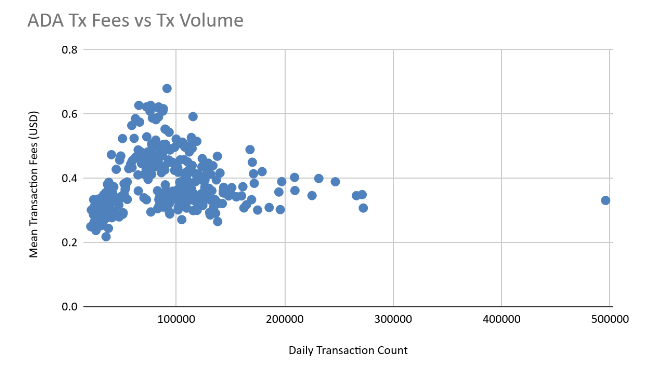
Figure 10
As you can see in figure 10, DigiByte has reached a transaction volume of 25k, which is relatively low, with regular transaction counts of approximately around 10k. However, the transaction fees are also relatively low in terms of USD. This is a non-scalable blockchain with low transaction fees.
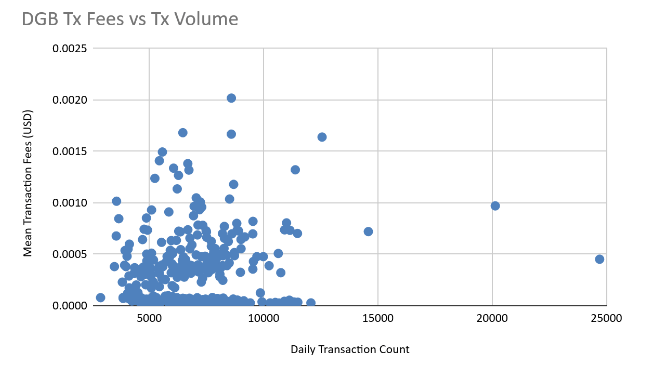
Figure 11
This figure demonstrates that the Stellar network is scalable enough to allow for transactions in the scale of 6-7M without facing congestion, but that at around 6M, its additional transactions count will heavily influence its transaction fees. In short, Stellar has very low fees but at higher volumes, it is heavily susceptible to price increases.
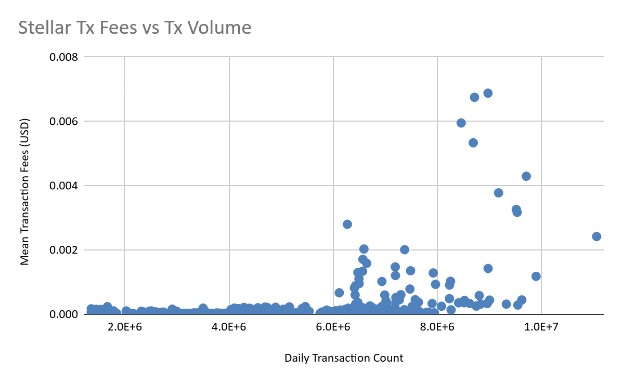
Figure 12
As you can see Cosmos is not very scalable, and its network has consistently only allowed for approximately 100,000 transactions per day – except for one day when transactions reach 130,000. In terms of fees, there seems to be a very weak influence of fees on volume.
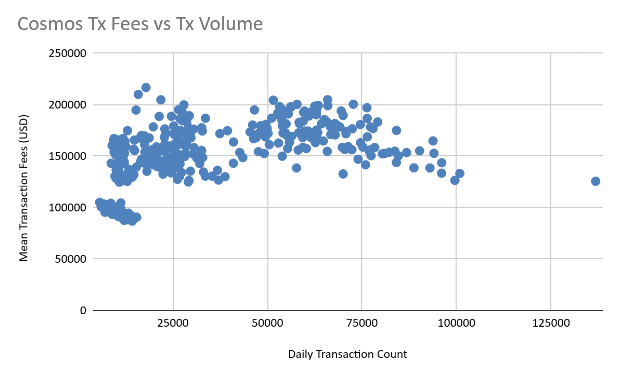
Figure 13
This figure demonstrates that Algorand is scalable enough to allow for transactions up to 5M per day. However, there is a positive correlation between transaction fees and transaction volumes.
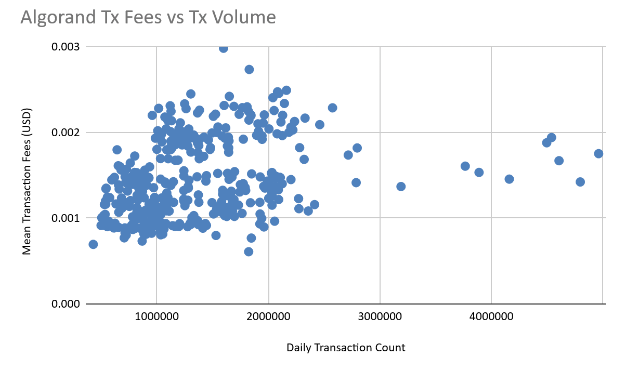
Figure 14-15: Matic / polygon
Figure 14
As you can see in figure 14, up to 8-9M transactions have been cleared through Polygon at its peak congestion, and the transaction fees have remained relatively low in dollar amounts (in cents) aside from two peaks in gas prices.
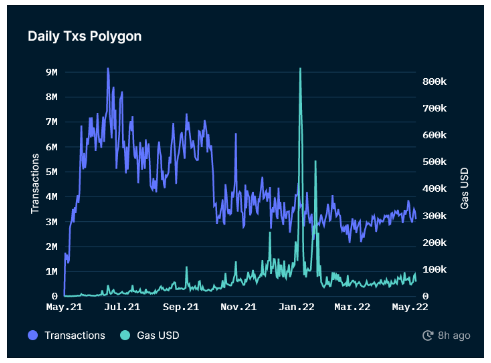
Figure 15
Figure 15A Figure 15B
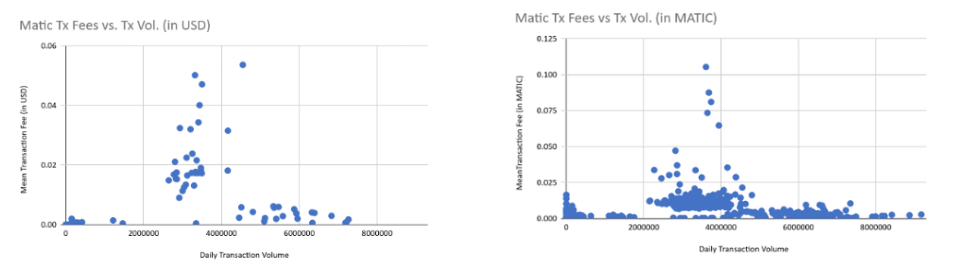
Figure 15A demonstrates that the scalability of Polygon Network (MATIC) has only been tested to a level below 800k transactions per day and that at higher transaction volumes (~300k) it has faced a price increase which deterministically demonstrates that higher transaction volumes could sometimes increase transaction fees on the Polygon network dramatically.
The argument arises that for various blockchains, the peaks in fees (in USD) might be due to the peaking price of their native tokens (e.g. MATIC) as opposed to an innate increase in prices due to congestion. We decided to test this idea against a coin with aggressive changes in pricing, and we chose Polygon (MATIC) because no other token had such aggressive changes in price over short periods. As you can see in figure 15B, the transaction fees (measured in MATIC) vs. transaction volume also demonstrate the same bi-modal distribution and the same price peak at about 200-300k transaction volume. Hence, we can see that the Polygon network has so far sometimes been able to contain transaction fees and at other times seen the transaction fees rise to over 5 cents. We believe that the same relationship of congestion with transaction fees is stronger than the relationship between token price and transaction fees for most if not all of the blockchains we have analyzed here.
Figure 16
Avalanche has produced up to 1.1 million transactions per day, and its transaction fees at those times have hovered at about $0.5 to $1. As you can see from the graph (please excuse us as raw data was not available to do statistical analysis) the transaction fees and the transaction volumes seem highly and positively correlated.
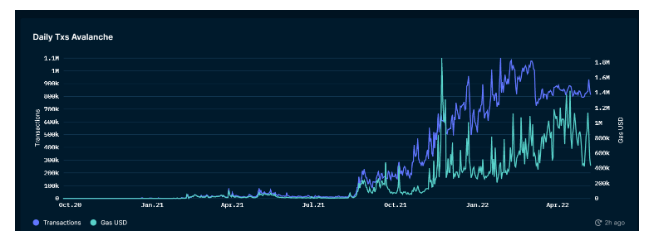
Figure 17
The Binance Network (BNB) Chain has achieved a transaction volume of 16m per day, and its transaction fees closely follow its transaction volume. Transaction fees are typically above $0.5.
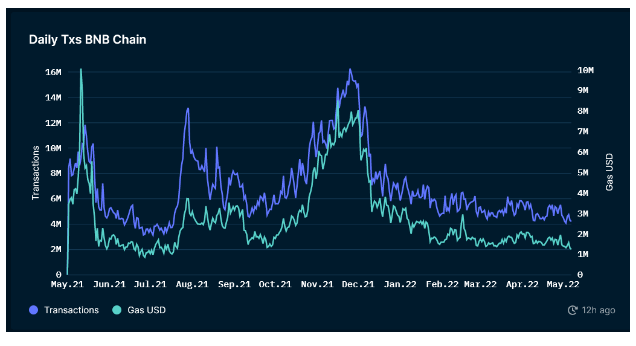
Figure 18
Optimism network transaction volume has risen to 90k per day, which is significantly lower compared to other protocols, and the transaction fees seem highly correlated with transaction volume. Typical transaction fees of ~100k USD for transaction volumes of ~50k average out at $2 per transaction and is unimpressive for a scalability solution.
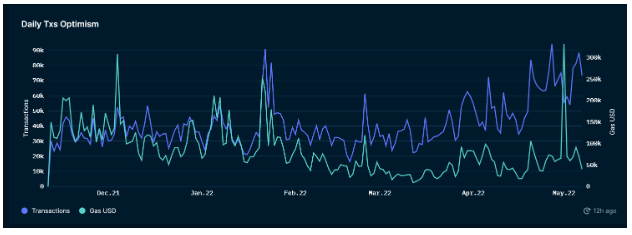
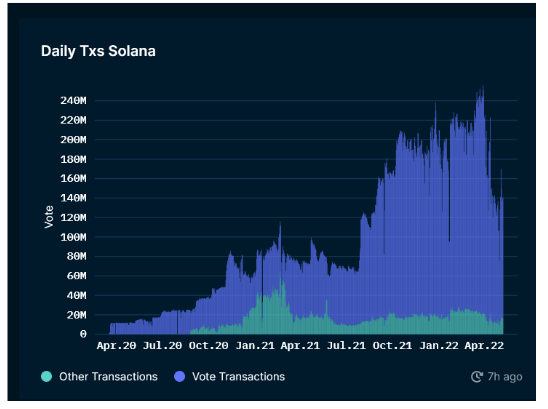
Figure 19
The transaction volume for Solana is impressive: it has reached 240m total transactions per day when including vote transactions.
In Solana’s Proof of Stake (PoS) consensus algorithm, the fork of the chain with the block which has the highest number of vote transactions is included in the blockchain. In other words, vote transactions are how validators vote for which transactions should be used in the next block.
Because vote transactions are an artifact unique to the Solana network and are required only for the running of the network, whereas non-vote transactions are traditional blockchain transactions that applications can use for the transfer of digital assets, running of smart contracts, and otherwise create efficiency and automation, we only consider non-vote transactions for measuring the scalability of Solana.
In this figure, we can see that the non-vote transactions peak out at 50M and typically reaches a maximum and perhaps a congestion level at 20M. The network has failed and gone down for many hours at these levels prior.
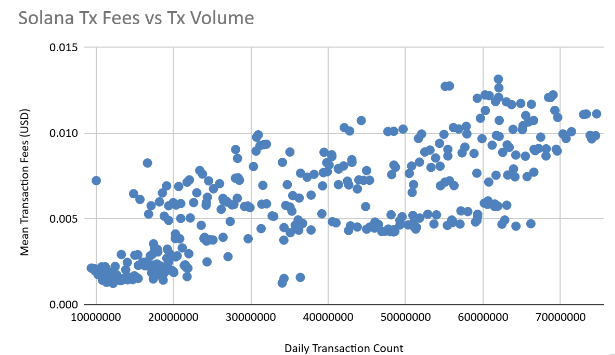
According to the official Solana explorer, the current average transaction fee for a non-voting Solana transaction is 0.0000053 SOL, and with SOL at approximately $100, it is equivalent to approximately $0.0053 per transaction. Solana’s transaction fees are strongly and positively correlated with its transaction volume.
Figure 20
Solana has proven to have stability problems due to nodes going out of sync with each other relatively frequently. For example, as of May 17, 2022, the official Solana explorer cites that the Solana network has been “down” for 1.11% of the time over the past month. That equates to a blockchain being down for approximately 8 hours per month.
Conclusion
It has been claimed that all of the aforementioned blockchains are all scalable in their design. Depending on one’s criteria, these claims can be justified, particularly for Solana, Stellar, and Bitcoin SV. For Solana, the metric to emphasize is the total transaction throughput at peak volumes. For Stellar, the key metric is price-per-transaction. At Unbounded Capital, we consider both peak transaction volume and average price per transaction valuable metrics, but these measures of efficiency do not alone make a blockchain “scalable”. We define blockchain scalability as a network that can maintain (and even improve) its low average price per transaction as its transaction volume increases over time to accommodate the necessary scale of large internet applications with virtually zero downtime. When considering this definition, our research suggests that only Bitcoin SV is currently positioned to offer this: as transaction volume increases, the average price per transaction decreases, a byproduct of the race-to-the-bottom market dynamics of a hyper-competitive and open market for offering transaction processing.
All three of these chains (Solana, Stellar, and Bitcoin SV) have kept relatively consistent fees and have not seen sustained exponential growth in fees. However, with the price-volume relationship that we observe for BSV, we predict that there won’t be a sustained spike in transaction fees with volume growth. We cannot predict the same for either Solana or Stellar, which will likely continue to have transaction fee spikes at times of peak transaction volume. Since periods of peak volume are by definition key periods for users of the networks, we foresee this being untenable for network users as users attempting to use the network will have to pay higher and non-typical fees or risk seeing abnormally high rates of transaction failures. Matters are made even worse when high transaction volumes halt all network activity as we have seen on Solana several times over the past few months which, by our calculations has been fully down for 1.11% of the time over the last 30 days.
There are other caveats to each blockchain that make them unequal in other important regards. For example, we must study how these impressive scale solutions have been achieved. For example, Stellar is not a typical blockchain in the sense that it has built-in points of command-and-control centralization, such that the Stellar Foundation arguably controls the entire network. The network contains only ~44 validators that are heavily centralized around the Stellar Foundation. Bitcoin SV is also relatively centralized at this point, but neither the Bitcoin Association nor any other institution holds the power to keep it centralized, and the current centralization of the network is led by economic incentives and different outlooks and perspectives of miners in terms of mining BSV.
Another issue is that Solana and Stellar follow a Proof of Stake consensus algorithm that has its inherent weaknesses that we have explained in our first book. PoS miners are not as directly incentivized to improve the speed at which they can process transactions. In this system, which is held back by the well-known phenomenon of the tragedy of commons, PoS miners have little incentive to invest in scale unless all miners invest in scaling the network. Finally, if we expect blockchain to be the core infrastructure on top of which businesses build, reliability is of paramount importance. Both the Solana network and the Stellar network have gone “down” on several occasions, whereas the Bitcoin or BSV network has never had outages due to network congestion, and has never gone down in any capacity since the very early days of the Bitcoin network currently known as BTC (between block 27 and 28, when the network had virtually no users or activity).
For all of the above reasons, we conclude that Bitcoin SV is the only scalable blockchain that exists today and is positioned to maintain its efficiency as network usage grows.
Watch: CoinGeek New York presentation, Investing in Blockchain Ventures
https://www.youtube.com/watch?v=SdWurEo58ok
Recommended for you