07-27-2026


|
Getting your Trinity Audio player ready...
|
You have all seen them. Impressive charts detailing how one blockchain is doing so much more X than Y, or how their project is better than another because of statistic Z. Well, today I’m here to methodologically go over these statistics so that you can have a better understanding of what they mean, and also be able to evaluate whether or not the supplier of the statistics are being fair and honest about the stats that they publish, which in the ‘crypto’ industry, should not be a given.
For this article, I’ll be going over the statistics available on the site bitinfocharts.com, as they are the most comprehensive and comparative blockchain statistics sites at present. They cover mainly all the major blockchain projects on most statistics except for carbon footprint1, which says a lot. One look at their site, you can see at a glance most of the essential stats of the major projects:
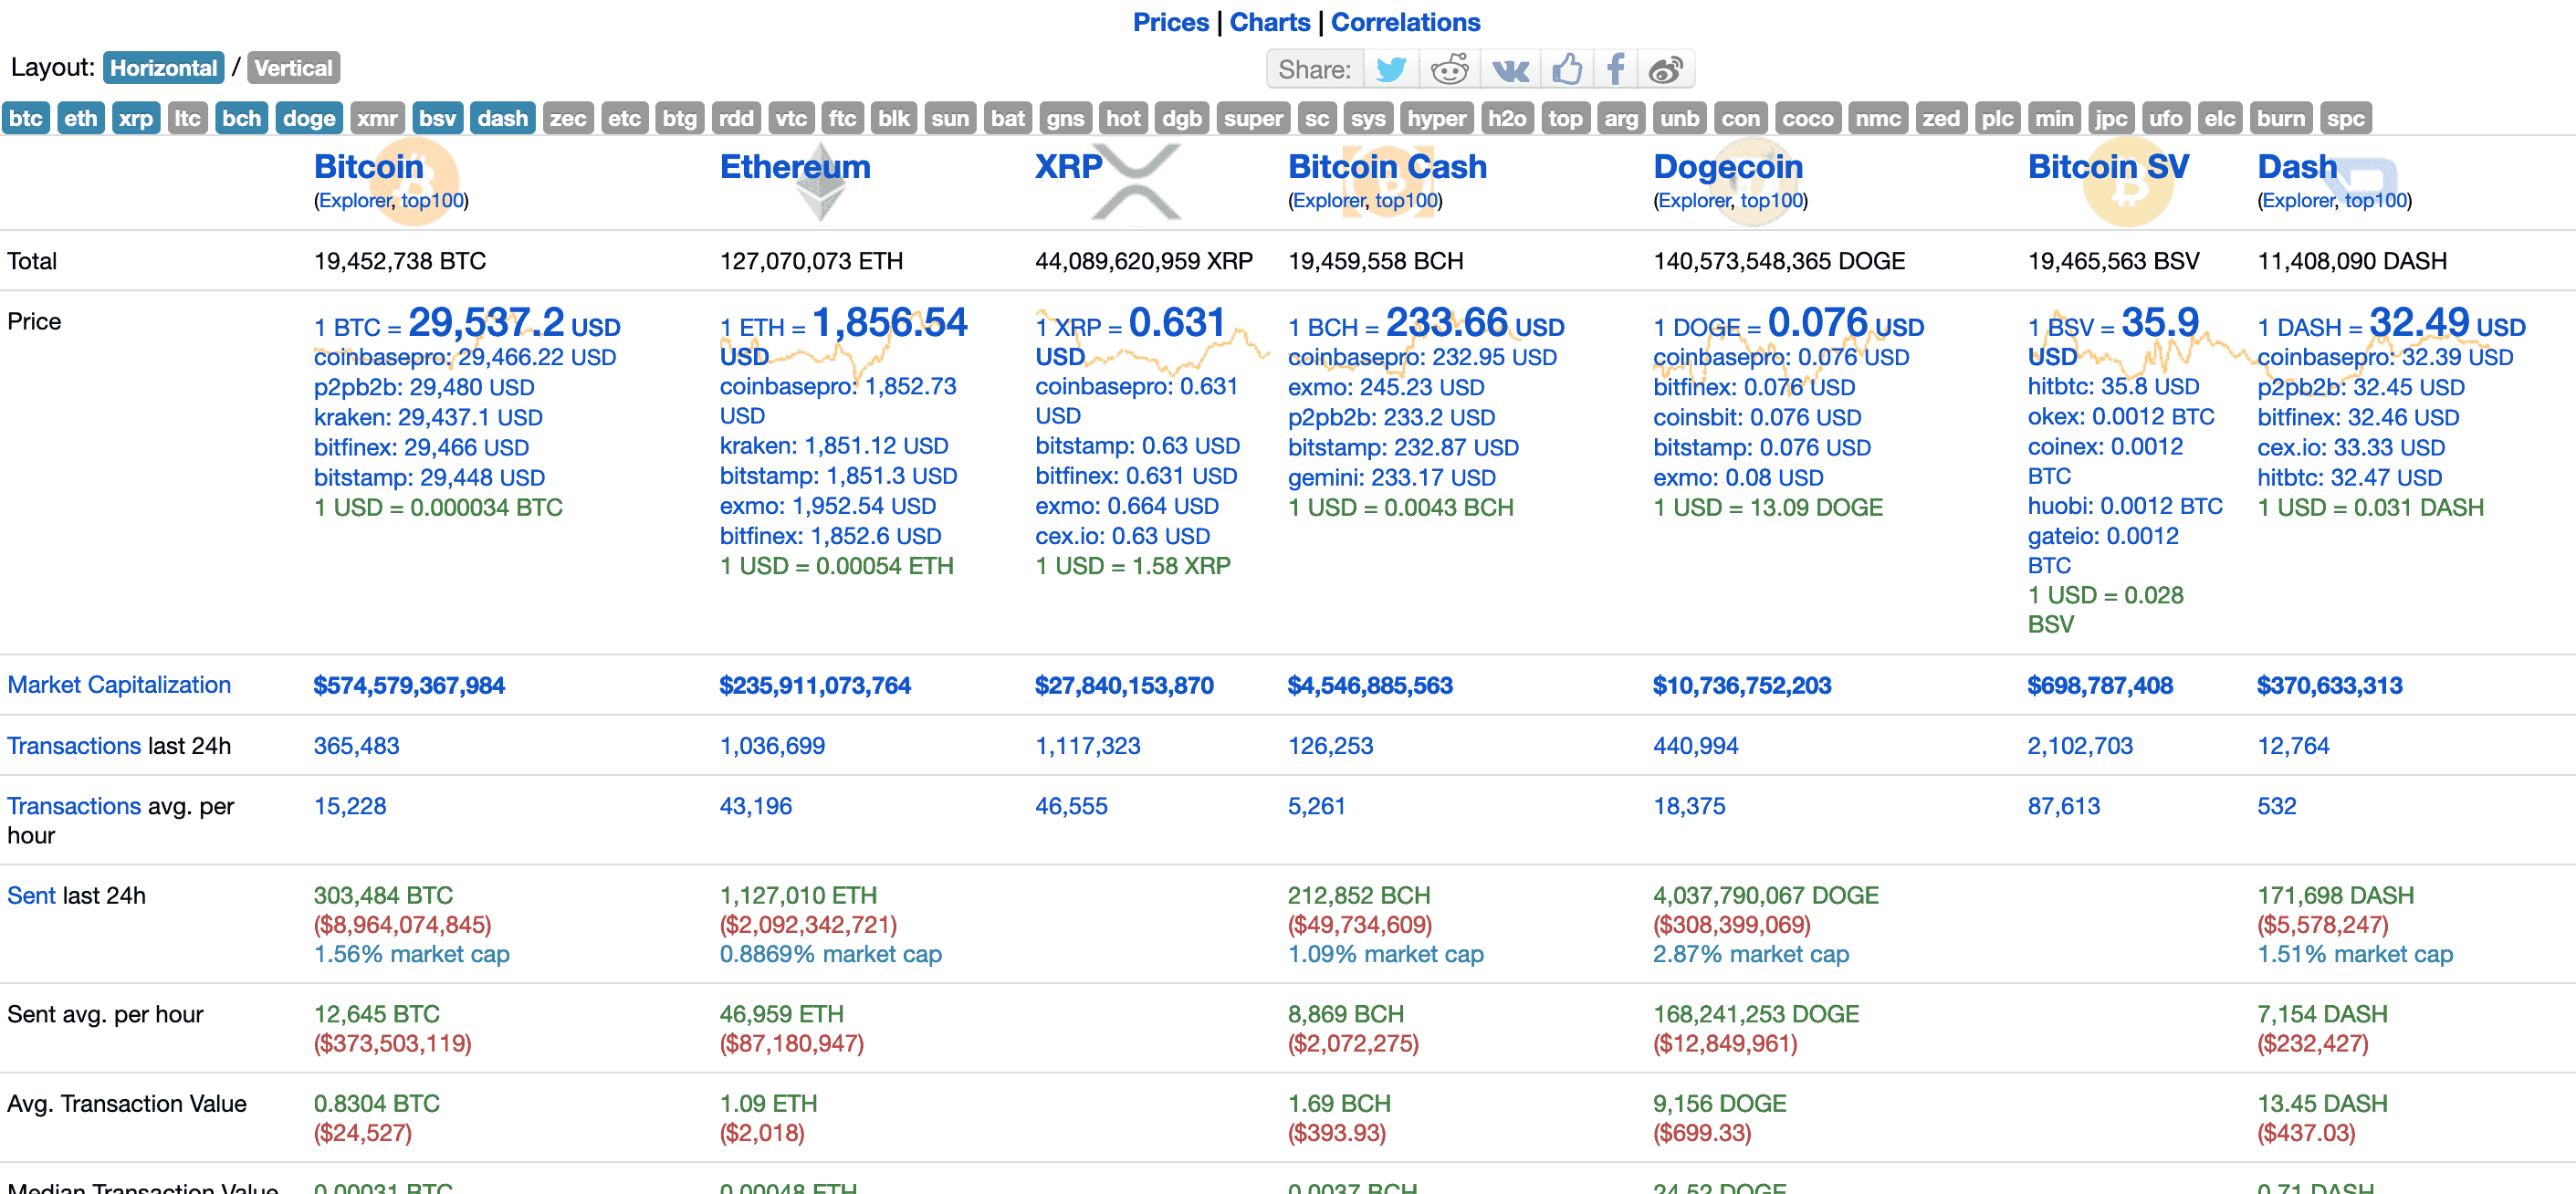
While these ‘headline’ statistics are useful, we will dive into the more illuminating charts section, ranking the top projects in certain categories that gauge real-world utility.
These stats can be found in the ‘charts‘ section below.
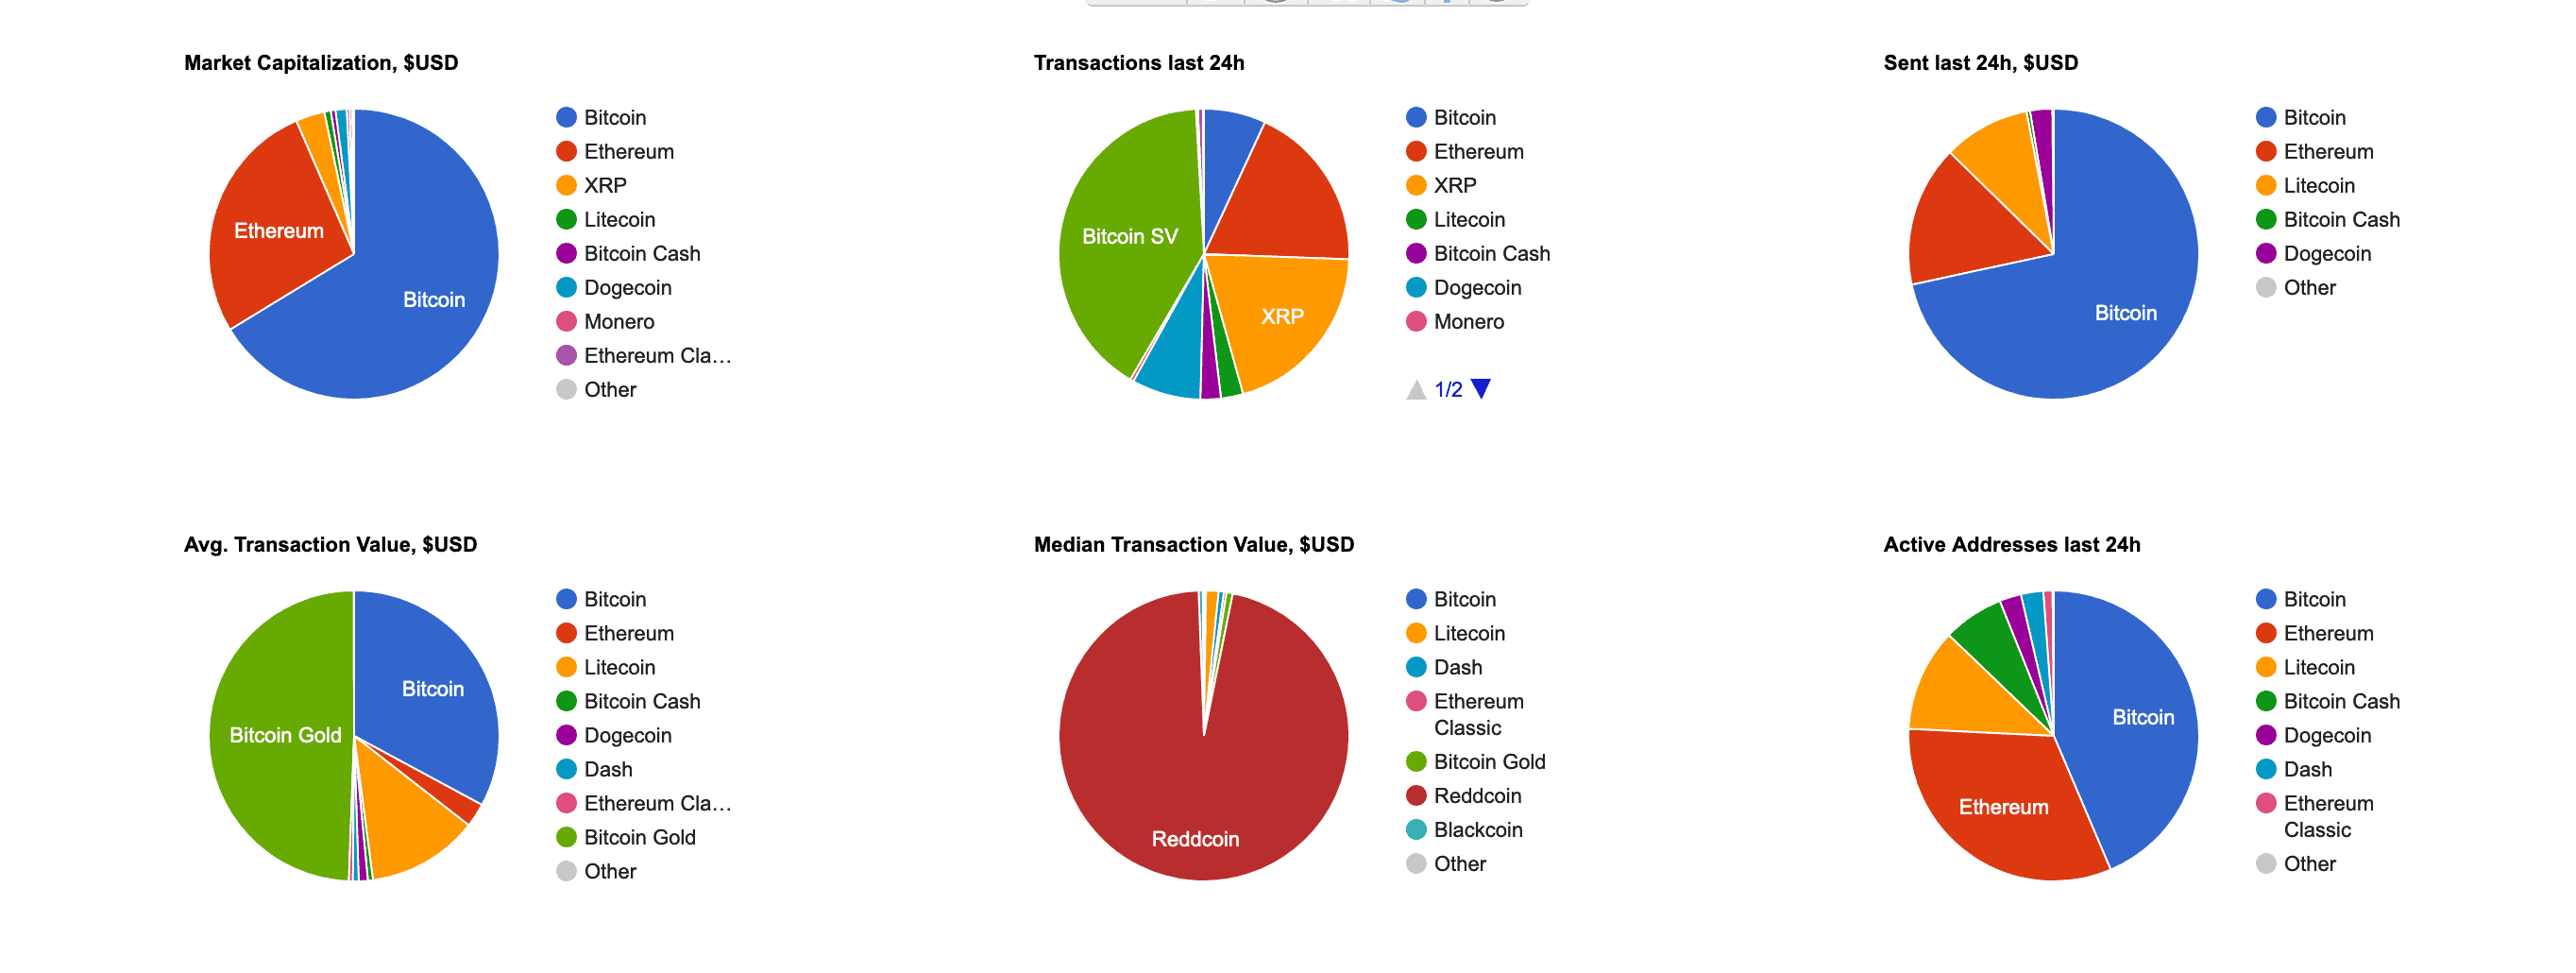
Let’s go over each chart in turn.
Market capitalization
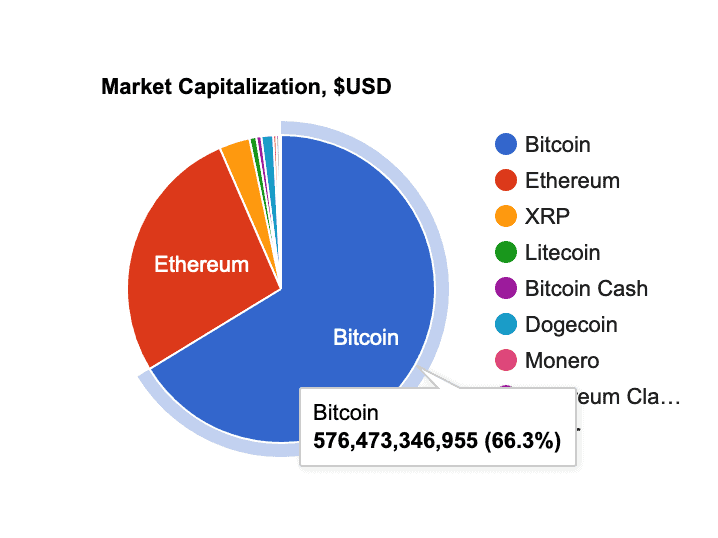
This is the granddaddy of stats, the market cap. Market capitalization is a carryover from equities markets in the real world and was ported into digital currency markets as a way to give normal stock speculators and investors a familiar metric by which to measure their digital currency investments.
In the real world, market capitalization is a number arrived at by multiplying the number of outstanding market shares of a company by the current stock price. This gives a general idea about how much the company is currently worth. The reason this metric is valid is because in order for the ownership of the company to actually be transferred, theoretically, the value of the market cap must be paid. (As buying up all the shares in the market would mean you own that percentage of the company; barring special share classes)
However, this metric is mostly used as a marketing spin in the digital currency world. It is simply the current trading price of a manipulated digital currency token multiplied by the supply. The factors that make this structurally different from the market cap in equities are two-fold:
1) Ownership of a digital currency token does not bestow ownership rights in any company or enterprise.
2) Unlike real-world equities, digital currency projects can simply issue an arbitrary amount of supply of their token, list them in any exchange, and claim an exorbitantly high market cap. This technique has been most famously demonstrated by Ripple and its XRP token, which issued 100 billion tokens at the project’s outset, but only sold them to private institutional buyers, limiting supply to public exchanges to small numbers in order to manipulate the price (and thus market cap).
This can be done easily in the digital currency industry because, whereas normally a company only gets a market cap when it IPOs on a registered securities exchange such as the NASDAQ, in digital currency, you can list on any less-than-scrupulous exchange or bucket shops in any jurisdiction and have a traded price. Therefore this metric is useful, just another way to look at the current market price. It is simply used as a way of normalizing market prices across different blockchain projects in order to rank them.
Transactions last 24h
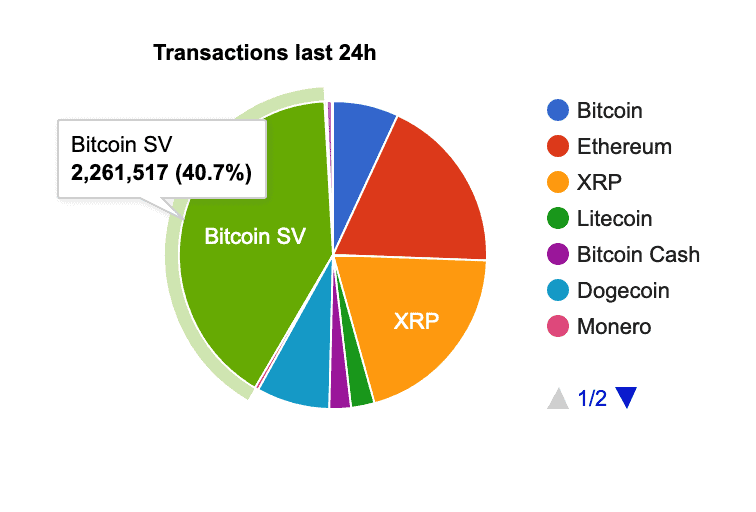
Now we move from a primarily useless metric (market cap) to the opposite end of the spectrum—transactions over the last 24h gauge how many transactions (txns) the blockchain processed over the last day.
It is useful as a metric to weigh how useful the blockchain actually is in terms of utility. Most often, blockchains compare themselves to each other by how many txns they can process in a second. While this may skew for peaky or maximum loads, transactions are actually processed over the course of a day, shows how much the blockchain is actually being used. This metric is the most important fundamental that can gauge the intrinsic value of the blockchain project itself. BSV blockchain consistently ranks top in this category due to its focus on real-world usage and high transactional throughput.
Amount sent last 24h
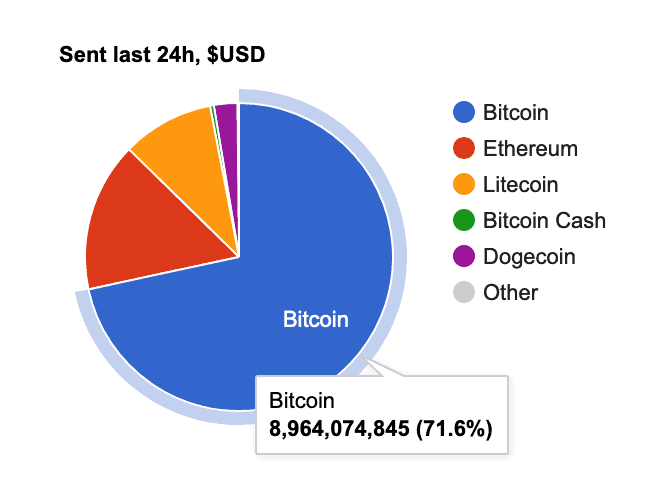
This metric evaluates the amount of coins that have been transferred in all the transactions processed over the last day and multiplies it by the coin price.
While on the surface, this is a good addition over the previous metric, in terms of how much real-world USD value has changed hands, this isn’t a good measure of real blockchain use. The reason for this is that the volume of trades going into and out of exchanges for speculative trading purposes is co-mingled into this number. In order for this metric to be valid, it should be weighted by the previous metric of gross transactions in a day to offset the effect of exchanges making few, large, high valued single transactions to move coins between their hot and cold wallets and other internal systems.
Average transaction value in USD
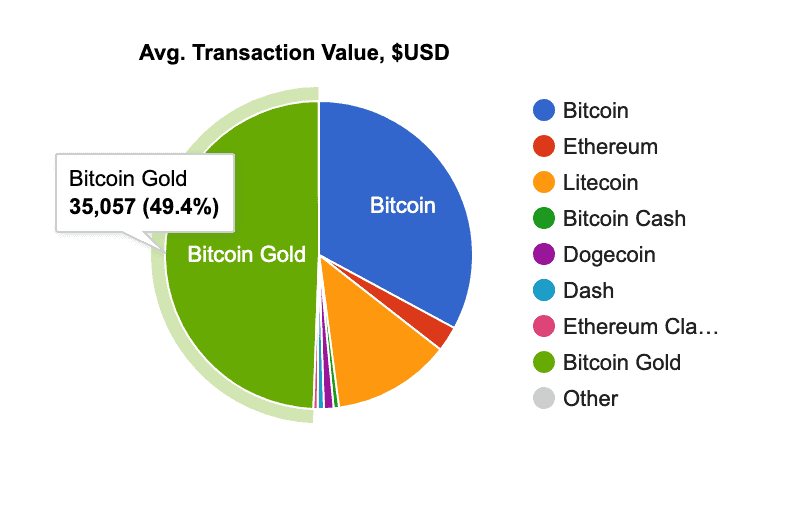
This metric is mostly useless, as one very large transaction, moving an extremely large amount of coins, will greatly skew this number upwards, as evidenced here.
Bitcoin Gold (BTG), a mostly fringe project with few real users or daily transactions, manages to win this category simply because a small number of very large (in nominal coins) transactions are done daily. This showing, coupled with the fact that BTG does not even make the chart for “Number of Transactions in a day,” is just evidence that this blockchain is the most centralized in terms of the holders of the coins. Only an extremely low number of total daily transactions could result in such a high showing in this category. (Imagine that a whale holder just sending himself a transaction worth $100,000 in coins daily would easily be able to achieve this number.
Median Transaction Value
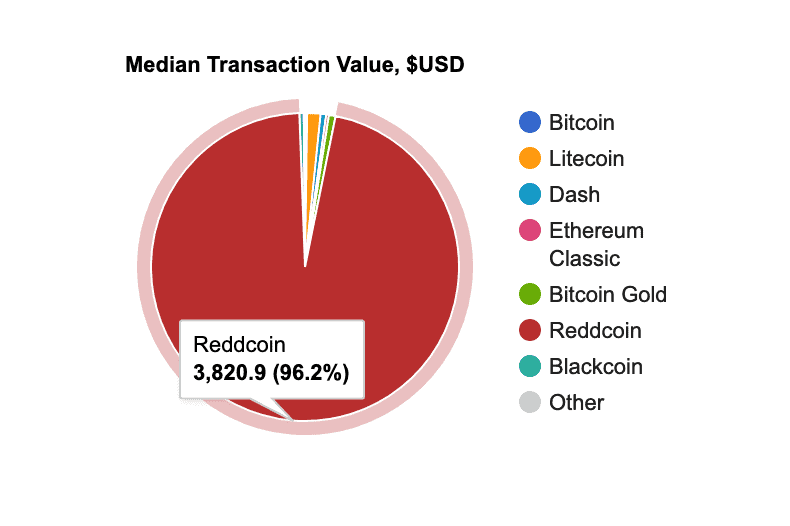
This is a better version of the previous metric, as it uses the median value transferred instead of the average. This is a good interpretation of what use case a blockchain is being used for. It would seem that Reddcoin is the most consistent as money presently. However, the fact that Reddcoin doesn’t show up in the #2 category should give any analyst some pause before drawing any conclusions here. When data is lacking, then few conclusions can be made.
Active addresses in 24h
Finally, we come to the most misleading of all blockchain metrics. Active addresses. This metric sums up all the different addresses that show up in transactions by some fuzzy notion of activeness. The issue here is what qualifies as “active.”
Since an address that holds a coin can be considered inactive, but a new address seen is clearly “active,” it falls to the statistics site to decide when an address ceases to be active. The easiest way to do so is by simply making a rule that an address with any activity (as measured by a transaction involving that address) within a certain period is considered active. The trouble here is that this method will completely ignore blockchains that encourage the use of one-time use addresses as part of their privacy model, such as BSV blockchain. In such blockchain projects, users always create new addresses to receive coins and never reuse any previous addresses.
Coins are never sent to an address that already holds coins from a previous transaction. This preserves the maximum privacy for users of the system against coin analytics which watch the blockchain in an attempt to de-anonymize users. The problem with this metric is that it will severely penalize such privacy focused blockchains, as their addresses will never count as being active.
This is a case where if the statistic sites improved their model, this would be a useful metric also to gauge blockchain usage and privacy levels. As it stands, the projects which rank the highest on this measurement likely rank the worst when it comes to protecting their users’ privacy, as addresses that can be tracked for “activity” are clearly hotbeds of scrutiny for blockchain analysis platforms. But if they improved the measuring method of activity, then what is this metric supposed to tell us? The number of addresses used isn’t really indicative of real-world blockchain use, as it depends on how the blockchain users create and use addresses. Remember that in blockchain, anyone can create as many addresses as they please, whenever they please.
But what of the Number of Transactions per second? This metric is notably missing from the site, yet it is often touted as the way to measure the scalability of a blockchain project, akin to horsepower in cars. Strangely, such metrics are not listed on popular sites.
For those curious, the present record for txns/sec is held by the BSV blockchain.

And there you have it, folks. The top six metrics, as reported by BitInfoCharts explained. I hope this has given you some insight into the relevance of some of these metrics and why some stats are worth more than others when it comes to evaluating performance and value between blockchain projects.
I also hope to have given you a fair dose of skepticism regarding the validity of some of the data on these sites, especially ones that do not go the length to explain how they arrive at their numbers. But if you are new to the digital currency industry, this is just part and parcel of an industry full of exploitation and manipulation.
Jerry Chan
Wall Street Technologist
NOTE:
[1] They likely won’t cover this because it would not show BTC in a good light, given that it burns as much energy as Argentina. It would also show Proof of Stake blockchains at an undue advantage, once again, over BTC.
https://news.climate.columbia.edu/2022/05/04/cryptocurrency-energy/
Watch Bitcoin Masterclass #3: Accounting and mapping transaction on-chain
Recommended for you